Show me the math
Ballast is an accountability layer for centralized GPU pools. It scores whether each org’s capacity reservation is calibrated against what the org actually uses, judged two ways: against peers with similar workloads, and against the org’s own track record. It then produces the evidence behind the score as an artifact anyone can inspect. The gap it fills: centralizing a pool delivers control (one queue, one decision-maker), but it does not make anyone’s reservation legible; a team inside a centralized pool is no better able to show that its ask matches its use than it was before. Over-reservation itself is rational: reserve too little and the failure is visibly yours, reserve too much and the cost diffuses into the shared pool. Google’s Autopilot paper describes operators who “naturally err on the side of caution and request a larger limit than the job needs.” The project exists because that gap surfaced the hard way: a capacity escalation reached the CEO, the CEO asked to see the math behind the ask, and the org couldn’t produce anything convincing.
Ballast is a sibling of DeploySignal, Tessera, Cairn, and Runway, built with the same Anchor methodology. It scores whether a team’s GPU reservation is calibrated against realized use, and that is the entire scope: it never decides who gets capacity. Allocation stays wherever it lives today. Disclosures before claims, as usual in this series: I built Ballast, so this is a maker’s account. And of its four headline validation results, two passed on real cluster traces and two are simulation-only. Which two are which is spelled out below, in the text, not in a footnote. The code is early (v0.0.1-pre, Apache-2.0 TypeScript); the validation record is the part worth reading.
The bar is your peers, not a utilization threshold
The score answers one question: when this org reserves capacity, how much does it realize? The raw material is the realization ratio, used over reserved, clamped to [0, 1.5]. The ratio is anchored twice. The first anchor is the peer reference class: orgs with similar workloads define what normal reservation behavior looks like. The second is the org’s own longitudinal track record: every past cycle of requested-versus-realized is evidence about this org specifically.
Empirical Bayes blends the two. An org with two cycles of history gets a score that leans almost entirely on its reference class; an org with a long record earns a score that is mostly its own. The machinery is a pseudo-count conjugate normal–normal update, which is plain shrinkage. It is also the same post-audit empirical-Bayes design as Runway’s slip priors, close enough that the known-answer property tests are transplanted between the two repos.
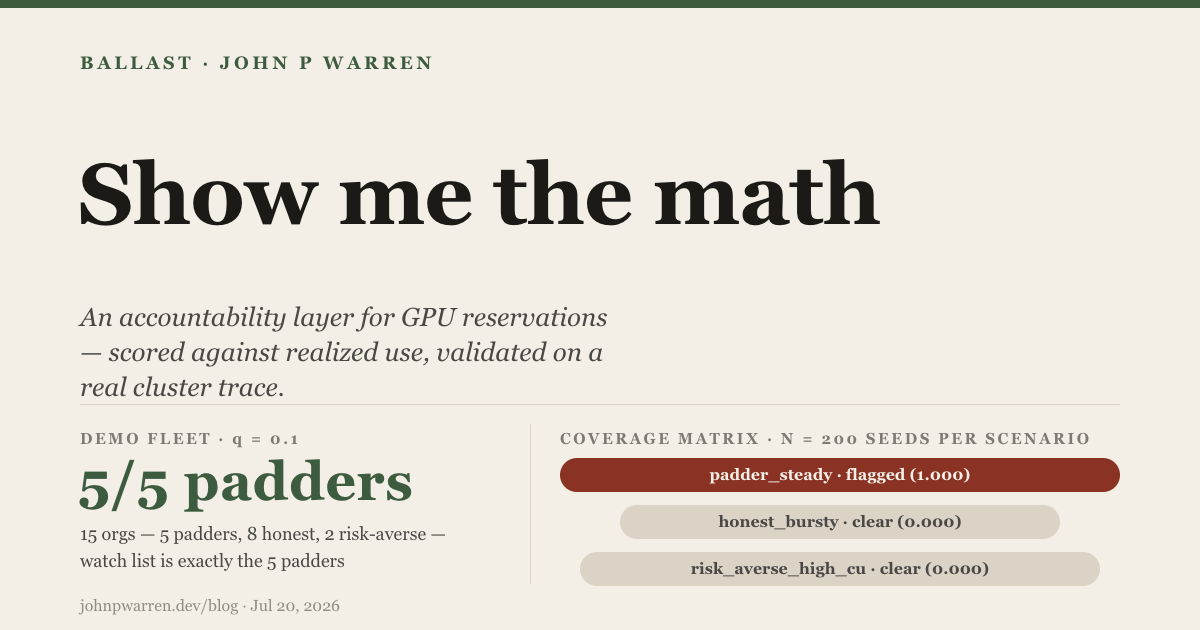
That gives each org a score. The fleet layer makes the scores monitorable: each org’s history feeds an anytime-valid e-process, which accumulates evidence across cycles and can be read at any cycle without invalidating its guarantees, so a persistent mismatch accumulates evidence and eventually crosses the threshold even when no single cycle looks unusual. Fleet-level false-discovery control comes from e-BH (Wang–Ramdas), consumed from deploysignal-engine. In the simulated demo fleet of 15 orgs (5 padders, 8 honest, 2 risk-averse) at q = 0.1, the watch list is exactly the 5 padders.
That sentence hides the crux, so here it is as a table. Coverage matrix, N = 200 seeds per scenario:
| archetype | reserves | flagged? |
|---|---|---|
padder_steady | high, low use | yes (1.000) |
honest_bursty | matched to demand | no (0.000) |
risk_averse_high_cu | highest (≈3.3×), lowest use | no (0.000) |
The risk-averse team reserves the most per unit of forecast (≈3.3×), utilizes the least, and is not flagged. A utilization-threshold audit would flag it first. Ballast doesn’t, because the bar is class-relative: the question is never “is your utilization above X percent,” it is “is your reservation behavior explainable by orgs like you.” Risk-averse and consistent is an explainable answer; a reservation that maps to nothing is not. One boundary the tool holds: in simulation, intent is known because we programmed it. On real teams, Ballast never claims to read intent. A mismatch is a correctness finding, not an accusation.
Over-reservation is also not the only behavior a pool has to care about, so the calibration score has mirrors. A sandbag detector watches the opposite failure: chronic under-reservation that externalizes stockout risk onto the pool. A Page-CUSUM changepoint detector watches late backouts, and prices them — in the demo scenario a launch slips at cycle 12, the downshift is knowable at cycle 14, and dumping the reservation at the deadline costs about 1.8× as much as releasing it at that point. Holding capacity you already know you won’t use has a computable price, with a computable “you knew by” date. And a pooling model de-rates the central buffer for correlated demand: at realistic GPU demand correlation, the naive √N pooling assumption under-sizes the central buffer roughly 6×.
What’s validated on real data, and what’s still simulation
Start with the miss. Ballast v1 scored orgs cross-sectionally: flag whoever sits in the tail of the peer distribution this cycle. On the real Alibaba cluster-trace-gpu-v2020 trace, that design failed one of its pre-registered pass/fail checks (its studies call these “endpoints”; this one was E1). Flag-rate by reservation-gap quartile came out [0, 0, 0.0071, 0.0127]: direction correct, magnitude far below the 0.25 clamp the endpoint required. The FAIL stands untouched in the study record, and it forced the redesign: v1’s cross-sectional snapshot became the longitudinal track record described above.
The v2 study was pre-registered on the same trace, 439 orgs across 5 gpu_type classes, run 2026-07-06, with four pass/fail endpoints frozen before any analysis ran — labeled F1 through F4, and referenced by those names in the tooling below. F1, predictive skill, passed: shrinking each org toward its reference class cut held-out squared error by 53.2% versus predicting with the class mean. F2, interval calibration, passed: coverage 0.802 (352 of 439 orgs) at ±1.28σ, against a nominal 0.80.
One dataset is one dataset, so the same endpoint code, imported unmodified with thresholds verbatim, ran against the Microsoft Azure Public Dataset V2: a 2019 VM trace, 2,695,548 VMs collapsing to 5,767 orgs across 4 core-count classes. F1 passed at −93.4%, with a caveat the study discloses up front: per-day usage is approximated by each VM’s lifetime average CPU, which plausibly inflates F1’s magnitude. The verdict is robust; the number carries that caveat. F2 passed at coverage 0.787. Both endpoints reproduce on a different cloud, a different resource type, and a different year.
That covers the two endpoints validated on real traces. The other two also passed, but only in simulation, which is a different class of evidence: F3, junk-resistance (a faithful-reporting agent beats a junk-reporting agent, margin +60.70), and F4, incentive efficacy (over-reservation drops 0.527 → 0.150, a −71.6% reduction, while utilization rises 0.753 → 0.850 rather than collapsing into under-reservation). No real organization has run Ballast’s incentive loop. The claim that scoring reservations changes reservation behavior is a model of an org, not an observation of one.
The packet, and what Runway does with it
Runway is this series’ capacity planner (introduced, then validated against public data), and Ballast now feeds it through a two-stage adapter that tracks the evidence. The coupling is deliberately loose: Runway’s BallastAdapter consumes JSONL wire formats, with no live coupling and no Python import of Ballast.
Stage 1 is display-only. A JustificationPacket maps to a ReservationIntegritySignal, and every rendering carries a label, verbatim: “Ballast peer-calibration — synthetic-validated evidence; displayed as claimed, not established fact”. This stage answers the original escalation. In the demo, the simulated over-reserving archetype presents a request of 279 units; the packet beside it shows 45.3% utilization against an 82% sanctioned bar, plus a calibration flag (e-process wealth 55.8 at cycle 17). That is the math the real team couldn’t produce.
Stage 2 is quantitative, and it stayed locked until the F1/F2 real-data pass unlocked it on 2026-07-06. A ballast.calibscore.v1 record maps to a CalibrationScoreSignal, and its r̂ ∈ [0, 1.5] scales each mapped customer’s demand in Runway’s honest-demand what-if: what does the plan look like if every ask matched its track record? Its label is also verbatim: “Org-anchored calibration score — externally validated on real trace data (Ballast v2 study F1/F2); incentive results (F3/F4) are simulation-only”.
One product decision closes the loop. The cross-org audit instrument, Reservation Integrity, lives on the Executive hub, because the Service VP’s own asks are the thing being scored, and an audit instrument does not live with the person it audits. The VP’s own section keeps exactly one lightweight caption: their personal score. The incentive loop F4 models only works if the scored party sees the score.
Ballast allocates nothing; it makes the reservation ledger legible enough to argue about with evidence. The next time someone asks to see the math, there’s a packet.